Innovation
Extending Spot's perception with computer vision
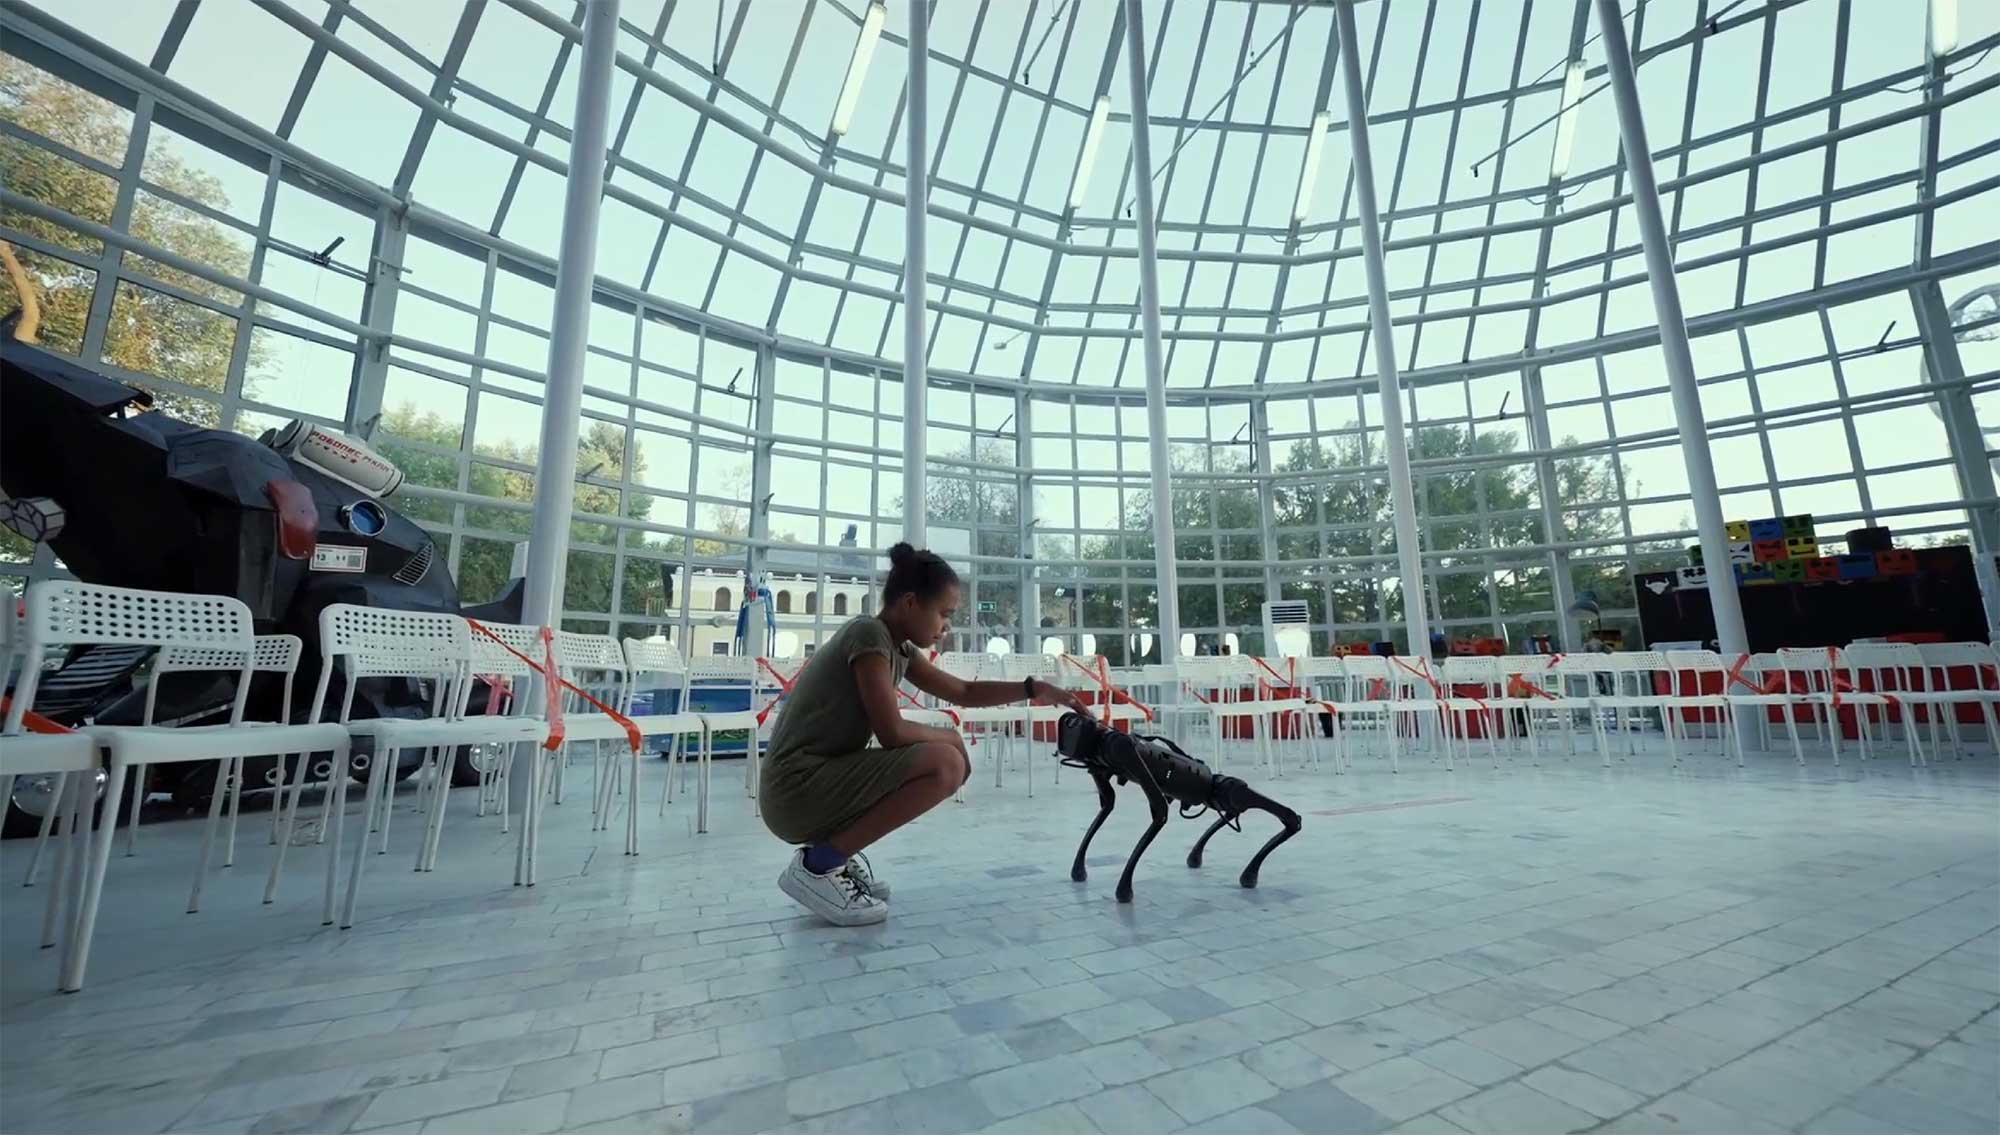
Recently, we deployed Spot at The Smart Factory by Deloitte @ Montreal where it performs an Autowalk Mission and live data displays in a custom-built dashboard for potential partners to view. More details on that can be found in our previous blog post: Spot Showcased at the Smart Factory by Deloitte @ Montreal. Along with a basic Autowalk Mission to collect data, we wanted to showcase how Osedea can use computer vision to pull out more value from the images. With data extracted from the images, we can easily trigger alerts to inform of potential issues as the data is collected.
In this post, we will run through how we added various data extraction solutions using computer vision to provide a demonstration of how Osedea can help you do the same at your facilities.
Tank & Reservoir inspection
An example of how computer vision can be leveraged to extract data from images, is tank & reservoir level and colour inspection.
For this, we preprocess our images into grayscale and apply a threshold to them and identify where our levels are based on the colour (solid black & white) shift. This tells us where the level of the contents is, which provides us a percentage when compared to the height of the tank or reservoir. With this percentage, we can trigger an alert if a tank is too low for instance.

Additionally, we can use simple computer vision techniques to identify the colour of the liquid within our tank. Below is an example of the level and color detection displayed in our dashboard.

Analogue gauge reading
Analogue gauges can be found throughout an industrial facility and can easily be read by humans, what about Spot? Sure, Spot can see and capture images of anything you tell it to, but that’s where it stops. Enter computer vision to extract the value of the gauge, with this approximate value, we can trigger alerts or notifications to operators if gauges report values outside a predefined range.
While there might be a lot of approaches to reading an analogue gauge with computer vision, we took the following approach:
First, we need to try and identify the “main” circle within the image, to do this we preprocess the image by converting it to grayscale and creating a threshold (solid black & white) image. From there we use OpenCV’s findContours and apply a little filtering logic to find the most central and appropriately sized circle.
Next, we attempt to identify the needle using OpenCV’s HoughLinesP and some additional filtering logic.
Now that we know the center of the gauge and the angle at which the needle is pointing, we can do some simple math to calculate the approximate value of our gauge with the help of a few user input constants such as the min and max values of the gauge as well as their angles.

While this works, there are a lot of factors that can make for a less-than-reliable reading of the analogue gauge. We can use other computer vision techniques such as object detection with a trained YoloV5 model via PyTorch. With this technique, we can take that consistent and precise data (photos of gauges) captured by Spot and annotate them to identify the gauge itself, the center (because more data is always good), and the tip of the needle. To do this, we can leverage our partners at SmartOne to help annotate large amounts of data to train a more robust model that will work on various gauges.
With these detections coming from our model, we can find the coordinates of the gauge and the needle tip with more confidence, and if not, we can fall back to the previously mentioned method.
Detection of safety equipment or other key points of interest
As previously mentioned, with enough data, Osedea can build and train object detection models to be run on any of Spot’s cameras. With this, we can achieve various visual inspections that will provide business insight, and work towards a safer environment, or other.
A simple example of this is to simply identify a pseudo lockout tag at the Smart Factory facility.


In conclusion
Boston Dynamics has created a very versatile dynamic sensing platform that can bring instant return on investment. However, much more value can be obtained by using machine learning techniques such as computer vision to extract data for business insights and predictive maintenance.
Osedea can also offer proof of concepts with Spot to see if it’s the right tool for you and your business. Send us a message, we’d love to discuss how we can collaborate!


Did this article start to give you some ideas? We’d love to work with you! Get in touch and let’s discover what we can do together.


.jpg)


